Real-Time Race Tracking® Statistics
Real-Time Race Tracking provides technology to accurately time races. They provide a website to live track athletes or view their result after the race.
Unfortunately they don't provide statistics about the whole race. This collection of scripts calculates the global statistics. Most of the api is well documented
import requests
import random
import json
from datetime import timedelta
from matplotlib import pyplot as plt
Every client needs a randomly generated uuid to interact with the api and an anonymous client is allowed to query 2000 records at once.
uuid = random.randbytes(10).hex().upper()
uuid
'57055175B94A616DB85C'
The event id uniquely defines the race, it is usually present in any URL to the event.
event_id = "RP-OSU-4MILER-25"
params = {"event":event_id,
          "sess": 0,
          "appid": "52139b797871851e0800638e",
          "token": uuid,
          "max": 2000,
          "start": 1,
          "source": "webtracker"
         }
We query 2000 runners until we reach the end and the last position is not the maxium one queried
data = []
res = requests.post(f"https://api.rtrt.me/events/{event_id}/places/overall/FINISH", data=params)
dat = res.json()
data += dat["list"]
while params["start"] + params["max"] -1 == int(dat["info"]["last"]):
    params["start"] += 2000
    print("check if there are more, starting at", params["start"])
    res = requests.post(f"https://api.rtrt.me/events/{event_id}/places/overall/FINISH", data=params)
    dat = res.json()
    data += dat["list"]
check if there are more, starting at 2001
check if there are more, starting at 4001
check if there are more, starting at 6001
check if there are more, starting at 8001
We save the data to easily reload it and don't need to scrape again.
with open(f"final-list-{event_id}.json", "w") as f:
    json.dump(data, f)
From the string data, we extract the time in seconds and the category they race in
times = []
for runner in data:
    t = runner["time"]
    secs = timedelta(hours=int(t[0:2]), minutes=int(t[3:5]), seconds=float(t[6:])).total_seconds()
    times.append((secs, runner["sex"]))
Optionally we search for a specific runner to show their position in the total statistics or show the fastest Karen
for i,p in enumerate(data):
    if "Karen" in p["name"]:
        break

t = data[i]["time"]
you_secs = timedelta(hours=int(t[0:2]), minutes=int(t[3:5]), seconds=float(t[6:])).total_seconds()
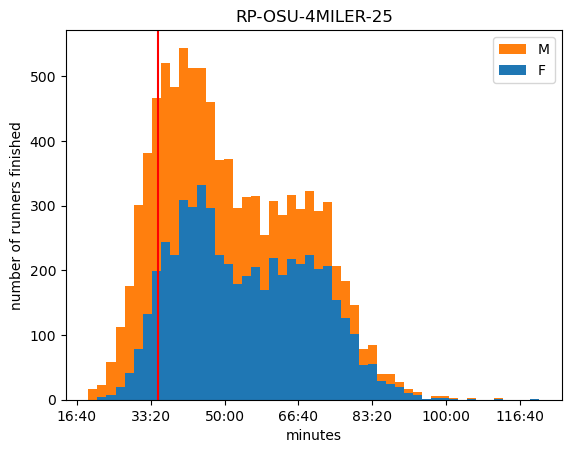
fig, ax = plt.subplots()

ax.hist([[t[0] for t in times if t[1]=="F"],[t[0] for t in times if t[1]=="M"]], bins=50, stacked=True, label=["F","M"])
ax.axvline(x=you_secs, color="r")
ax.set_xlabel("minutes")
ax.xaxis.set_major_formatter(lambda x, pos: f"{int(x//60)}:{round(x%60):02d}")
ax.set_title(event_id)
ax.legend(reverse=True)
ax.set_ylabel("number of runners finished")
plt.show()