Change Distribution
Interested by Matt Parkers youtube video on the UK £1.75 coin, I thought it would be interesting to challenge the assumption that all change amounts are uniform.
import matplotlib.pyplot as plt
import numpy as np
import random
These are the amounts spent in 2023 and 2024 at ICA Sweden rounded to a full krown and modulo 20 (the smalles note)
amounts=[18, 12, 12, 0, 12, 2, 16, 5, 12, 12, 8, 7, 14, 8, 8, 15, 5, 16, 8, 5, 19, 7, 18, 6, 11, 14, 19, 11,
         6, 6, 2, 16, 7, 13, 1, 16, 13, 2, 2, 1, 7, 16, 7, 7, 1, 16, 16, 13, 19, 0, 4, 12, 7, 2, 19, 12, 11,
         12, 6, 5, 0, 4, 2, 4, 4, 12, 10, 6, 13, 9, 11, 6, 11, 5, 19, 8, 13, 1, 7, 0, 4, 10, 10, 2, 18, 1, 12,
         19, 19, 10, 11, 7, 3, 12, 18, 14, 1, 10, 19, 3, 19, 6, 4, 13, 15, 8, 18, 9, 18, 3, 16, 6, 4, 18, 5, 17,
         19, 5, 18, 11, 1, 17, 8, 9, 6, 12, 6, 1, 0, 19, 9, 10, 10, 0, 7, 5, 9, 17, 5, 5, 17, 6, 11, 8, 0, 16,
         12, 3, 3, 6, 3, 14, 17, 17, 14, 2, 10, 0, 18, 2, 16, 18, 7, 17, 16, 15, 5, 6, 7, 4, 4, 12, 13, 9, 15,
         13, 6, 17, 18, 18, 0, 2, 8, 16, 16, 6, 11, 18, 0, 4, 7, 5, 14, 9, 9, 0, 10, 4, 18, 3, 18, 5, 12, 14,
         3, 14, 16, 1, 3, 17, 2, 3, 12, 1, 9, 7, 13, 13, 11, 9, 0, 18, 13]
As we are interested in the change we get back, we use the rest to the bext multiple of 20.
change = [20-a for a in amounts]
plt.hist(change, bins=20)
plt.show()
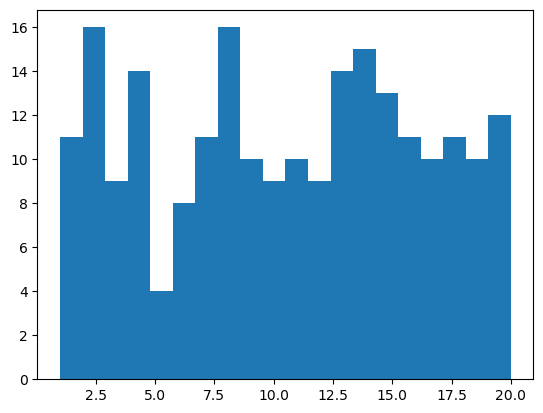
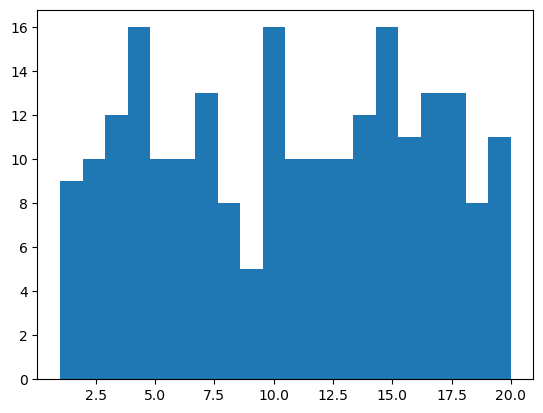
The distribution is quite flat, but and very similar to the histogram when sampling the same number of uniform points:
plt.hist([random.randint(1,20) for _ in change], bins=20)
plt.show()
A simple greedy algorithm to get the number of coins required for a specific amount. Sweden only has 4 coins
def greedy_coin_change(coins, amount):
    coins = sorted(coins, reverse=True)
    count = 0
    for coin in coins:
        while amount >= coin:
            amount -= coin
            count += 1
    return count
Average number of coins using a uniform distribution
np.mean([greedy_coin_change([1,2,5,10],x) for x in range(1,20)])
np.float64(2.3157894736842106)
Average number of coins using the actual change
np.mean([greedy_coin_change([1,2,5,10],x) for x in change])
np.float64(2.3497757847533634)
What would be the best 4 coins in Sweden. But we want to be able to use the greedy algorithm, so we only check for coin sets for which greedy yields the optimal.
For this we check a non greedy version of optimal coins
def dp_coin_change(coins, amount):
    # Dynamic programming solution to get optimal number of coins
    dp = [float('inf')] * (amount + 1)
    dp[0] = 0
    for i in range(1, amount + 1):
        for coin in coins:
            if i - coin >= 0:
                dp[i] = min(dp[i], dp[i - coin] + 1)
    return dp[amount]
def test_greedy_is_optimal(coins, max_amount):
    for amount in range(1, max_amount + 1):
        greedy = greedy_coin_change(coins, amount)
        optimal = dp_coin_change(coins, amount)
        if greedy != optimal:
            # print(f"Greedy fails for amount: {amount} (Greedy: {greedy}, Optimal: {optimal})")
            return False
    return True
Generate all possible coin sets with 4 coins from 1 to 19 with 1 included to support all amounts
coinsets = []
for c_2 in range(2,20):
    for c_3 in range(c_2+1,20):
        for c_4 in range(c_3+1,20):
            coinsets.append((1,c_2,c_3,c_4))
greedys = []
for cs in coinsets:
    if test_greedy_is_optimal(cs, 19):
        greedys.append(cs)
We now check all greedy coin sets and see which one provides the least amount of coins for a uniform distribution
avg_uniform=[]
for ma in greedys:
    avg_coins = np.mean([greedy_coin_change(ma, x) for x in range(1,20)])
    avg_uniform.append((avg_coins, ma))
min(avg_uniform)
(np.float64(2.1578947368421053), (1, 2, 5, 12))
It looks like they only need to slightly increase the 10 krown to 12.
avg_actual=[]
for ma in greedys:
    avg_coins = np.mean([greedy_coin_change(ma, x) for x in change])
    avg_actual.append((avg_coins, ma))
min(avg_actual)
(np.float64(2.192825112107623), (1, 2, 5, 13))
Using the actual numbers, the minimum is just 1 off.
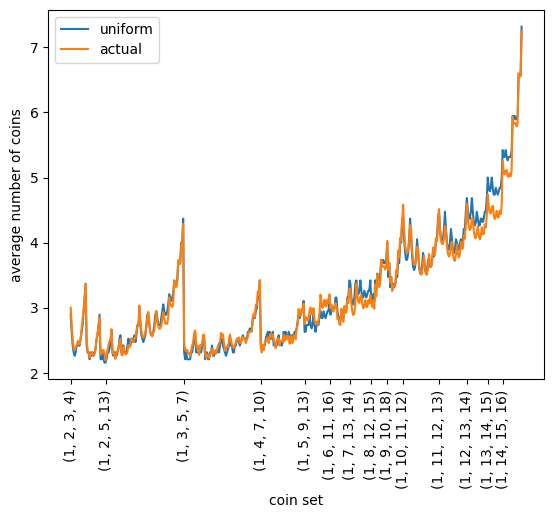
Comparing the full graph, the uniform is very close to the actual amounts.
tickpos = [ [m[1] for m in greedys].index(snd) for snd in sorted(set([m[1] for m in greedys]))][:-3] + [35]
plt.plot([x[0] for x in avg_uniform], label="uniform")
plt.plot([x[0] for x in avg_actual], label="actual")
plt.legend()
plt.xlabel("coin set")
plt.ylabel("average number of coins")
plt.xticks(tickpos, [greedys[pos] for pos in tickpos], rotation=90)
plt.show()